Cal-Adapt website tools visually project future climate change effects in CA
/This is a re-posted entry from the UCANR Forestry Blog.
Using Cal-Adapt.org to get a local snapshot of the future climate in California
Author: Maggi Kelly
Author: Kevin Koy
Editor: Richard B Standiford
March 21, 2013
Background
By 2008, the Public Interest Energy Research Program (PIER) led by the California Energy Commission (CEC) had collected more than 150 peer reviewed reports on climate change, had funded dozens of researchers and organizations investigating climate change scenarios, and produced thousands of statewide GIS (geographic information system) data layers depicting downscaled climate projections across the state. The agency had a number of needs: they wanted relevant information presented in easy to understand themes and topics, they wanted interactive maps and charts providing a variety of approaches to explore different aspects of climate change; and they wanted improved access to primary climate change data in GIS and tabular formats.
The agency wanted to develop an innovative web based platform to increase access to the wealth of climate change research and data being produced by the scientific community in California. They wanted a platform that addressed multiple types of publics: we wanted to address the general public, who want to learn about climate change data relevant to their area, we wanted to address local planners and technicians, who need to obtain meaningful information and data to help guide locally relevant climate action plans and adaptation strategies, and we wanted to address the scientific community, who need to access primary data relevant to an area of interest.
We at Berkeley’s Geospatial Innovation Facility (GIF) (http://gif.berkeley.edu) worked with the CEC to develop the “Cal-Adapt” analysis platform as an open source, web-based GIS and visualization project. The Cal-Adapt.org website is a new resource for the state of California that: 1) hosts a wealth of GIS data on modeled climate futures, 2) allows users to visualize past and future projected climate layers in a map framework, 3) provides all the data for download. This blog gives you a quick look around the website. Please feel free to explore the site, and your own area.
Cal-Adapt's development is a key recommendation of the 2009 California Climate Adaptation Strategy: “The California Energy Commission will develop the Cal-Adapt Web site that will synthesize existing California climate change scenarios and climate impact research and to encourage its use in a way that is beneficial for local decision-makers.” – Page 9, 2009 California Climate Adaptation Strategy.
The Climate Background
Scientists studying climate change usually frame climate discussions in terms of four climate scenarios, of which two had been downscaled for California by Scripps Institution of Oceanography called “B1” - The lower emissions scenario, and “A2” - The medium-high emissions scenario. Scientists use a multitude of different global circulation models, each developed and run at different scientific labs, project how the climate will change under each of these two scenarios. Four of these were models were used by scientists at Scripps and made available to Cal-Adapt:
NCAR - National Center for Atmospheric Research Parallel Climate Model (PCM1);
CCSM - Community Climate System Model Version 3.0 (CCSM3);
GFDL - Geophysical Fluids Dynamic Laboratory (GFDL) CM2.1; and
CNRM - Centre National de Recherches Météorologiques.
Each model uses different assumptions and drivers and can lead to differences in their outputs, so there is an advantage to using a variety of these models when conducting analyses.
Local Snapshot Example: Eureka and Humboldt County, California.
Humboldt County, located in Northwest California, is the southern gateway to the Pacific Northwest. The County is bound on the north by Del Norte County; on the east by Siskiyou and Trinity counties; on the south by Mendocino County and on the west by the Pacific Ocean. The County encompasses 2.3 million acres, 80 percent of which is forestlands, protected redwoods and recreation areas. Humboldt County faces a range of changes to its local climate: temperature, snowpack, fire regimes and sea level. Each of these can be explored with Cal-Adapt Local Snapshot tool.
Changes in Temperature
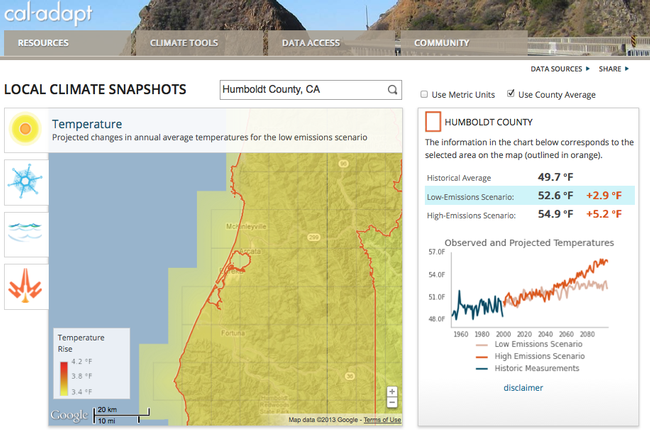
For example, if you want to explore the temperature changes projected over the next century, you can use our local climate snapshot tool. Figure 1, left, is the projected change in annual average temperatures across in Humboldt County’s under a low carbon emissions scenario (B1). The map above shows the projected difference in temperature between a baseline time period (1961-1990) and an end of century period (2070-2090).
In some areas of California, such as San Bernardino County, the average annual temperature is expected to go up by as much as 4°F (low emission scenario) to 7°F (high emission scenarios; in Humboldt County, temperatures are expected to increase by between 3° F to 5°F (low emission to high emission scenario).
Changes in Snowpack
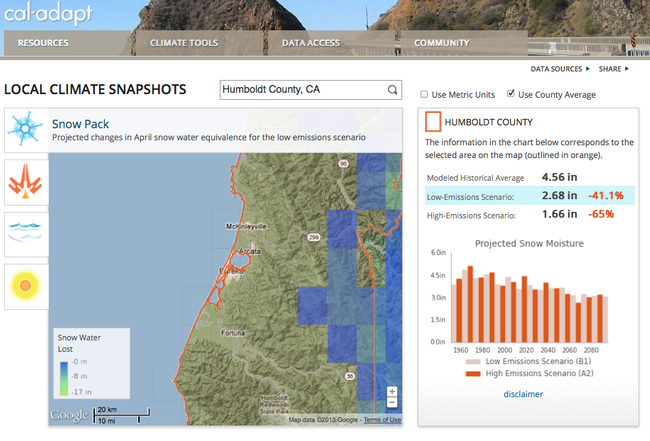
Figure 2, right, shows the projected changes in April snow water equivalence (SNWE) across Humboldt County under a high carbon emissions scenario (A2). The map shows the projected difference in snow water equivalency between a baseline time period (1961-1990) and an end of century period (2070-2090). According to the projections, in some areas of California, up to 25 inches of snow water are expected to be lost in April over the next century. In Humboldt County, the modeled historical average snowpack is 2.91 in. Under the low-emissions scenario, snowpack is projected to be 88.5% of that amount; under the high-emissions scenario, 98% of snowpack is projected to be lost. These drastic projections are thought to be the results a combination of factors including not only a decrease in preciption, but an earlier melt given warmer temperatures.
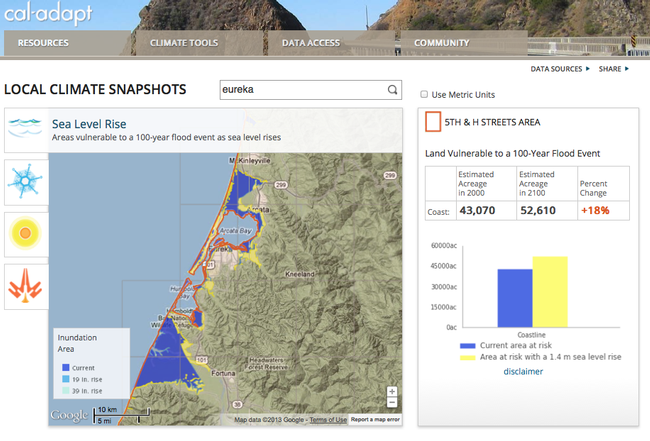
Figure 3, left, shows areas vulnerable to a 100 year flood event as sea level rises. The blue areas on the map indicate areas already in threat today, while the lighter shades are areas projected to also be in threat given the expected sea level rise. Humboldt County has a long coastline, with considerable areas of coastal wetlands that might be vulnerable to sea level rise. According to the projections from the Pacific Institute, 18% more land in Humboldt County may be vulnerable to a 100 year flood with a 1.4m sea level rise. 43,067.4 acres are vulnerable now, with a 1.4m sea level rise, 52,607.3 acres could be at risk. Some areas of the state, including the San Francisco Bay Area face increases of up to 40+% in areas vulnerable to sea level rise.
Changes in Fire Regime
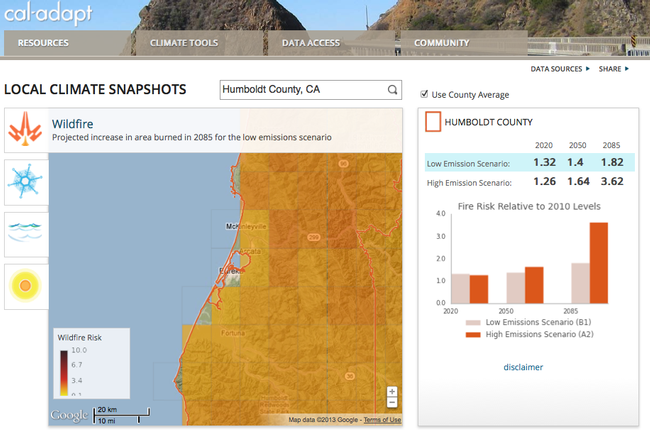
Figure 4, right, shows projected increase in potential amount of area burned in 2085, as compared to present risk, across Humboldt County under a low carbon emissions scenario (B1) for the CNRM model. The darker oranges displayed on this map above suggest up to a 3-fold increase in potential area burned. Other areas in California have a higher risk, for example, Siskiyou, Modoc and Shasta Counties have high projected increase in fire risk in the next century. These data and projections come from UC Merced: Climate Applications Lab.
Information Sharing
The website allows for sharing with your colleagues in a range of ways. You can create links that save your zoomed map with all its content and visualization choices, and these are shareable through Facebook and other social media projects:
- Temperature:
- Snowpack:
- Fire:
- Sea level:
You can also use many other sharing tools:
- view your map in Google Earth
- Download a table of these results
- Download the source GIS files
- Save this map as an image
- Print a PDF report of this climate information
Data Downloads
In addition to the examples above, there are many other data available for visualization and download at the Cal-Adapt.org website. For example, you can view and download monthly layers, from 1950-2099 for the following datasets: Actual evapotranspiration, Average temperature, Baseflow, Fire, Fractional moisture in the entire soil column, Maximum temperature, Minimum temperature, Net surface radiation, Precipitation, Relative humidity, Runoff, Snow water equivalent, Soil moisture at bottom layer, Soil moisture at middle layer, Soil moisture at top layer, and Wind. These data can be downloaded in a range of formats, over any date range, and directly integrated into your own GIS or modeling software package.
More Information:
The site has been developed by UC Berkeley's Geospatial Innovation Facility (GIF) with funding and advisory oversight by the California Energy Commission’s Public Interest Energy Research (PIER) Program, and advisory support from Google.org. The data used within the Cal-Adapt visualization tools have been gathered from California’s scientific community, and represent the most current data available wherever possible. Learn more about the variety of scientists and organizations that have contributed data and resources to Cal-Adapt. For more information about mapping for a changing California, see Maggi Kelly’s website at: http://kellylab.berkeley.edu.

